One of my favorite data sources is this lesser known dashboard from Altos Research. It’s a great way to keep the pulse on your own market.
Altos Research is a Mountain View, Calif.-based research firm that tracks over 20,000 ZIP codes, and is often quoted on Washington Post, Forbes and WSJ for their data. Their co-founder, Mike Simonsen, also posts great insights on twitter and youtube. Worth following.
To my knowledge, Altos provides the only free source of weekly housing market data with actual values.
The dashboard allows you to subscribe to reports for regions you are interested in, but you do have to provide an email address. As far as I can tell, they only send me a weekly email when the reports are updated.
To subscribe, click on my report for San Diego, and then click on the link that says, “Click here to stay informed with the San Diego market!” It will let you subscribe and then you can pick whichever markets, cities, counties, zips you are interested in.
P.S. I don’t get any referral/affiliate anything, it’s just that I can’t figure out how else to subscribe than clicking on that link in my report. /Dis
Weekly Market Data
This is a graph of weekly data, updated every Friday, with historical info to same week in 2019. Click on the red inventory button to select other statistics.
The dashed line is the 7 day average and the solid line the 90-day average. If you mouse over the graph, you can see the real numbers behind the graph. To my knowledge, Altos provides the only free source of weekly housing market data with actual values (and not just percentage change year-over-year).
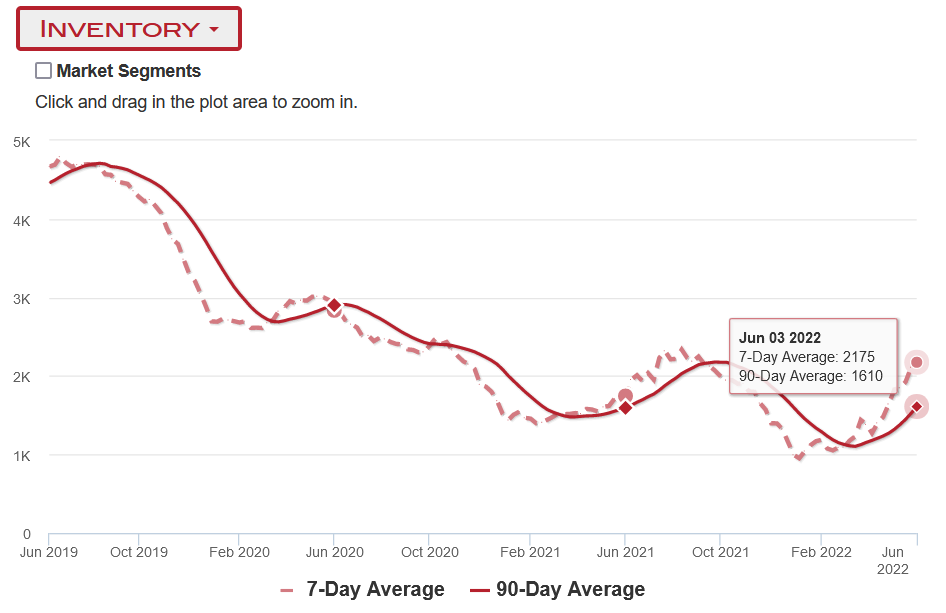
One awesome thing to notice in the graph above. They add markers in the previous years, to let you eyeball the year-over-year changes. Above you can see that San Diego inventory is higher than 2021, but yet to hit 2020.
They provide data for the following stats:
- Median List Price
- Average DOM
- Median DOM
- Price per square foot
- Market Action Index
- Properties with Price Decrease
- Properties with Price Increase
- Relisted
- Inventory
Market Segments
Another neat feature is “market segments” where you can see changes based on price tiers, but only for 90-day averages.
They divide the housing into 4 segments, such that each represents approximately 25% of the market ordered by price. From highest price to lowers, these are the top, upper, lower and bottom segments.
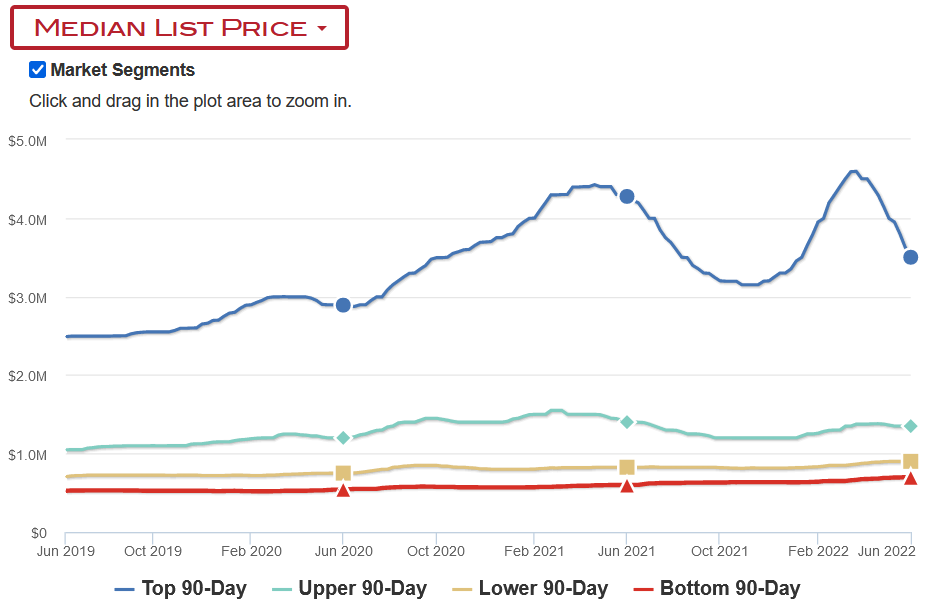
So you can see above that the top tier of housing is starting to fall in San Diego (over the 90 day period) but the bottom two tiers are holding steady.
Market Action Index
Altos also provides a “market action” gauge which they define as an index which answers the question “How’s the Market?” by comparing rate of sales versus inventory.
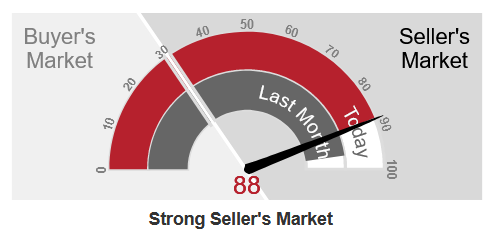
It’s a little confusing to look at at first, but essentially this shows that the market action in San Diego is 88 today (red gauge) compared to 95 a month ago (grey gauge).
And that they believe a value over 30 indicates a seller’s market, and below would be a buyer’s market.
Real-time Market Profile
Finally they provide a “real-time market profile” which is just a set of sparklines of key metrics, sort of a summary of the data available in the graph. But visible in a glance so you can see any big moves.
You can dig down further into any of these in the larger graph.
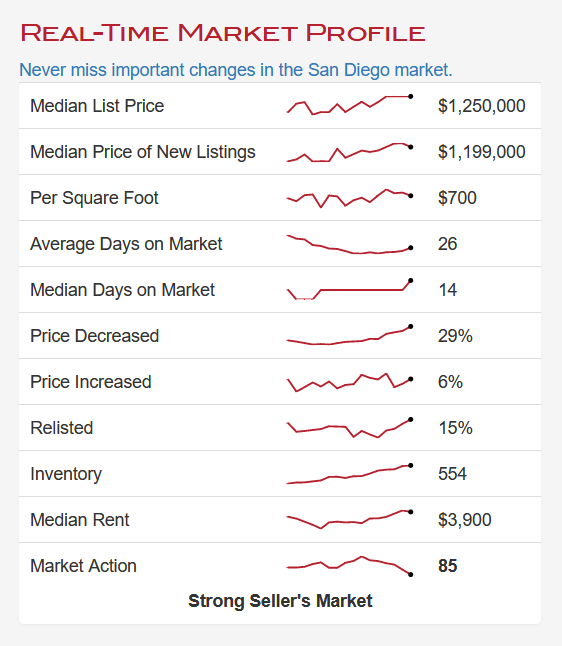
You can mouse over the sparklines to see actual values here too!
To subscribe, click on my report for San Diego, and then click on the link that says, “Click here to stay informed with the San Diego market!” It will let you subscribe and then you can pick whichever markets, cities, counties, zips you are interested in.
Such great data from Altos Research. To find more data sources, here’s my main article with the links at the bottom.
Disclaimer: I’m an idiot first time home buyer. I’ve never taken an econ class in my life. I’m just sharing what I see and learn as it happens. I am 100% certain I will get things wrong, so don’t take any of this as the golden truth.
Thanks