One interesting RE market to watch these days is Canada. It appears to be a few months ahead of the US in terms of a possible housing correction.
Granted, the market in Canada is different in many ways – their loans tend to be 5 year fixed loans and they never had a crash in 2008, so their rent-to-income ratio is sky-high. They also have only a few major cities that almost everyone lives in.
However, there are some similarities, like seller and buyer psychology in the housing market. Also Canada’s not that different, their financial regulators tend to move similarly to ours and their money is invested in the same ways.
The greatest frenzy…
So what can we observe from our neighbors up north? One is that the frenzy hits peak crazy right before things turn around.
For example, right now in the US, inventory is building which means demand has dropped but prices are still hitting record highs. Many seem to take this to mean that prices are still going up this year, and at worst might grow slower. Basically, that low inventory means that prices cannot fall and the increasing prices are a sign of that.
But hey, we had the same situation in Canada a few months ago. Looking at the Toronto market, in January, the consensus was that low supply would ensure that prices would continue to climb. Even though interest rates were set to rise, home prices soared, and had never increased as fast.
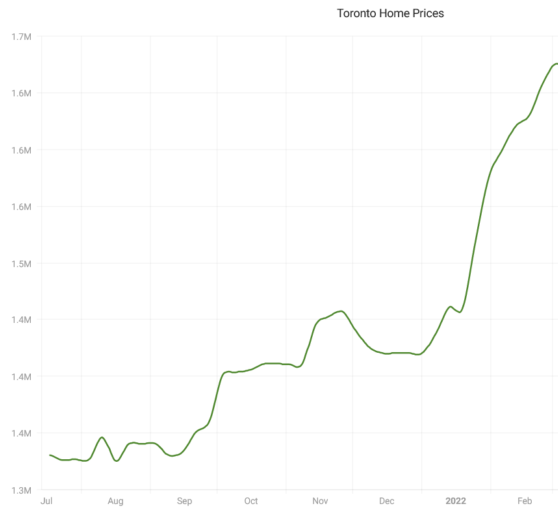
Look at how vertical that line looked in Jan and Feb.
TRREB data shows home prices soared in January. Low inventory and a long warning for interest rates, helped to drive demand to send prices to a new record. Warning people rates will rise months in advance appears to have the opposite effect of actually raising them.
Toronto Real Estate Prices Have Never Increased This Fast
Greater Toronto real estate prices are surging higher at the fastest pace in history… Prices are now 33.29% ($314,667) higher than last year — about the cost of a whole house in Canada just over a decade ago. It’s an unreasonable amount of price growth.
– BetterDwelling.com
… comes before the fall
And yet, 3 months later, Toronto is seeing median price has dropped. Sales plummeted as demand has completely dried up, resulting in home prices dropping from CAD$1.68m to CAD$1.53m. The shift in the industry was felt on the ground, but didn’t really show up in the numbers for a few months.
House sales in April are down 26% over March, a period in which sales are usually trending up, and average prices for low-rise suburban houses have been declining over the past two months. House sales were down 44% on a year-over-year basis.
– MoveSmartly
The average price for a house in April was $1,527,743 down from $1,679,429 in February, but up 17% over last year; the median house price in April was $1,348,94, down from $1,485,000 in February, but up 18% over last year.
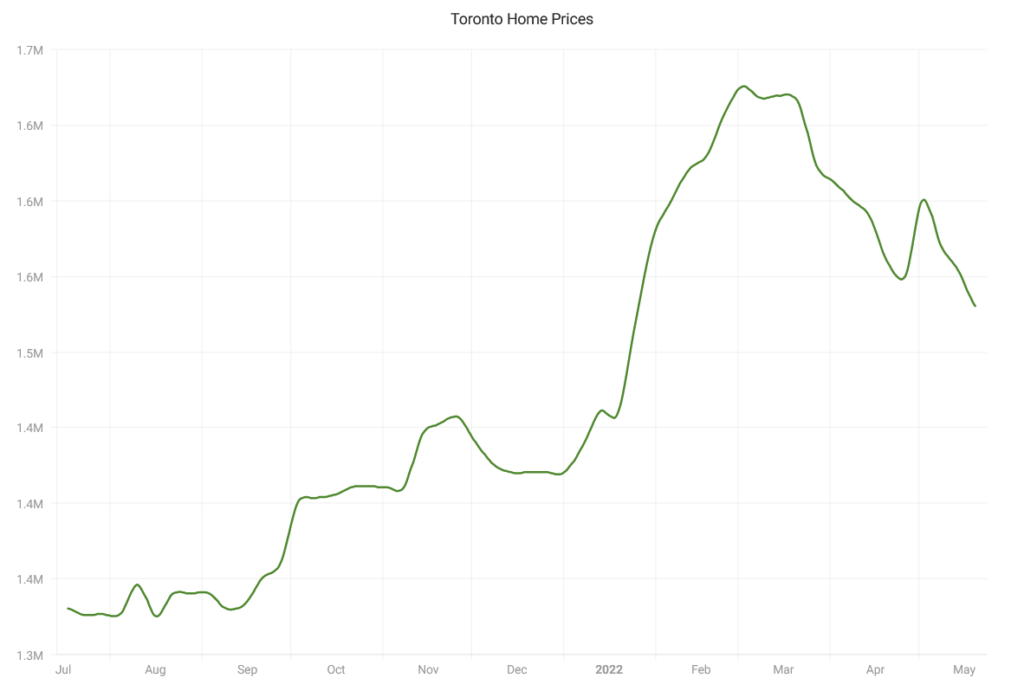
So this tells us an interesting thing about the psychology of homebuying. Right before demand completely dried up and home prices fell, Toronto real estate prices had “never increased this fast”. This seems so counterintuitive, but that’s the way this works.
The Offer Cliff
Here’s the thing – (and this is total armchair expert opinion right here) when you drop from 20 offers to 10 offers, to 2 offers, you can still sell at your high list price. So prices keep going up. But when you drop from 2 offers to none, suddenly everything changes. That’s the offer cliff.
In the US, we’re still at the 20 –> 2 offer stage. There are a number of home buyers who are desperate and have been looking to buy for the last year. They will NOT stop until they find a house or are no longer able to get a loan.
The fact is Canadians live in the same world we do – in which we are just recovering from Covid, facing supply chain crises and high inflation, watching their interest rates rise in tandem with our own, their investments crash alongside ours, and tracking the housing market in realtime with apps and data that didn’t exist in prior housing crashes.
And when the market changes and the Fed raises rates, only the people tracking those market signals take a step back. Demand drops, but the average buyer, who often has no idea rates are changing until they have to finalize their loan, keeps going.
In fact, with the lowered demand, suddenly they are successful! They manage to “win a house”! You can see this in first time home buyer forums right now – 9/10 posts are about closing on a home and getting the keys. Whereas a month ago, it was depression and deflation.
So they push through those last offers before the cliff is reached and the waning demand means some homes suddenly get no offers.
First sign of the cliff
So when you go from 2 offers to 0 (which by the way takes less time than it took to go from 20 to 2) guess what? The seller might need to drop their price. This is where you reached the cliff, when buyers didn’t give you a single offer at your desired top price.
Are we seeing this? We sure are, in some markets, on some percentage of homes anyway. The national data shows the percent of active listings with price drops now exceeds pre-pandemic levels.
See the black line below. The blue line represents 2019.
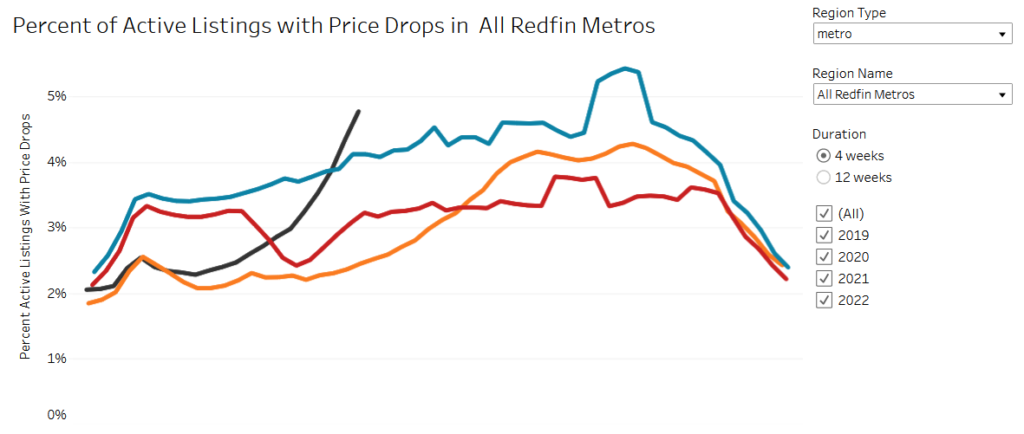
Does it mean the seller drops the price to something affordable? Hell no, sellers are in shock, they heard they’d get 10 offers before the open house, no matter how high they price, and here they are one week later with no offers. So they drop the price a measly 10k and hope this was a blip.
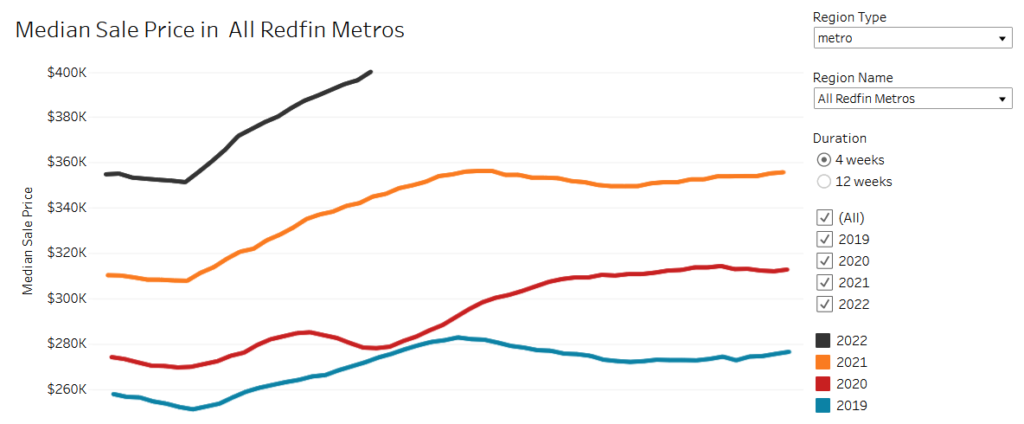
And to add to that, does this mean we see the price drop reflected in the sales data? Not yet, instead as Toronto did, we hit higher and higher price records on sales, because that data lags by 1-2 months.
Crystal Ball
So in a sense, watching Toronto gives us a possible crystal ball into how this might go in the next few months. Now, don’t read too much into it – because of course, their market is different, their financing options are different, and they recently approved but haven’t enacted a ban on foreign investments. So it really doesn’t necessarily play out the same way, but just as I can learn from comparisons to the 2008 crisis, or the early 80s period, we can learn by watching Canada.
The fact is Canadians live in the same world we do – in which we are just recovering from Covid, facing supply chain crises and high inflation, watching their interest rates rise in tandem with our own, their investments crash alongside ours, and tracking the housing market in realtime with apps and data that didn’t exist in prior housing crashes. All these things have an effect on the market and psychology of buyers and sellers.
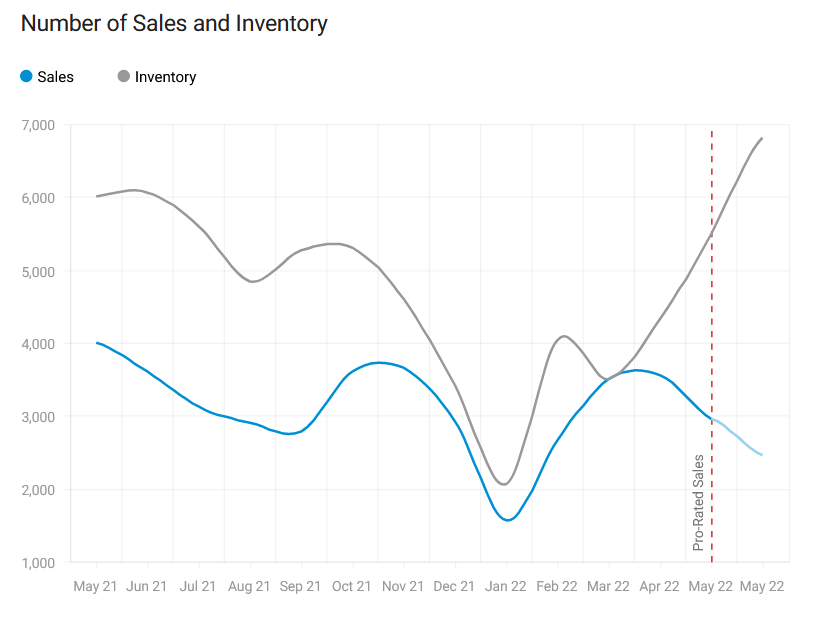
With that in mind, here’s a graph of their sales and inventory. It’s interesting to note that in the last burst of frenzy, their sales went up and inventory went back down, so it may be possible we see something similar.
For me, the speed of the change is surprising, it practically turned on a dime. And that might reflect the new reality today where we can track home prices on our phones, and see statistics change weekly, and some data like showings traffic change practically real-time.
So I’m watching Canada, just as I watch other markets within the US, to see what patterns arise. Frankly our neighbors to the north have had a much worse market for many years and it’s very possible they correct and we don’t. They definitely deserve more affordable housing. My vested interest in Canada is that I have nieces and nephews there that will need to afford housing in their future.
Disclaimer: I’m an idiot first time home buyer. I’ve never taken an econ class in my life. I’m just sharing what I see and learn as it happens. I am 100% certain I will get things wrong, so don’t take any of this as the golden truth.