This past week, there’s been some good news in terms of inventory which is great news for patient home buyers!
New homes supply
New homes supply is up to 9 months of supply. New home sales fell 16.6% in April and as a result, supply is up. New homes data comes from builder companies and is therefore is often collected separately from the existing homes market.
Builders report buyer demand has dropped significantly, leading to growing supply. In fact, this level of supply is well over the range of “normal” supply for new homes as is obvious from CalculatedRisk’s graph below.

Existing homes inventory
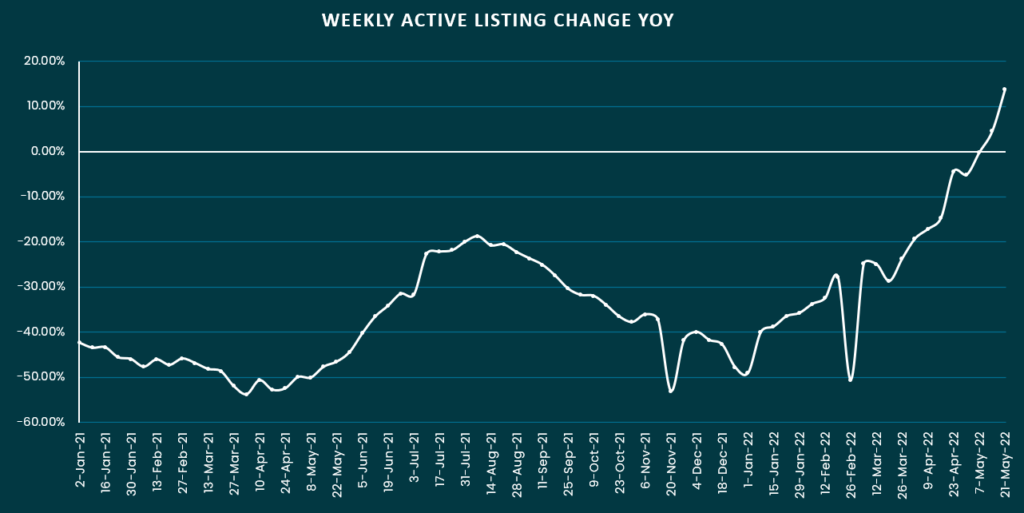
The inventory of existing homes for sale was 9% higher compared to the same week last year, according to new data from Realtor.com. It’s the largest year-over-year increase recorded since they started tracking this data in 2017.
This rise in inventory is far and above a normal increase. Believe it or not, the increase we’ve had in the last 2 months has not been seen since 1983.
You can see below that line is going up vertically at this point. This was at -30% year over year in January. This is a good sign despite still being low.

This rise in inventory is far and above a normal increase. Believe it or not, the increase we’ve had in the last 2 months has not been seen since 1983. It is up 23% in the last 2 months.
Single-family resale inventory in April was up 12% sequentially, the fourth largest increase for the month of April in the 40 years of available data. This followed March’s 9% sequential increase, which was the third largest expansion for the month over this timeframe. As a result, the two-month increase of 23% was the largest February to April expansion since at least 1983.
– Zelman Associates Blog
While there’s still a way to go, this kills the narrative that inventory would dry up further due to sellers not selling.
Existing homes in San Diego
The same data for San Diego shows that active listings are 14% higher than the same week last year, up from a very depressing -50% in January. I calculate this to still be -60% from 2019 listings.
Killing the “sellers won’t sell” narrative
When the rates first went up, the narrative was that this would cause sellers to hold on and never sell. Why would they give up 3% rates to buy a house with 5% rates? As a result, new listings would dry up even further.
But while this makes sense for some – homeowners who bought very recently for e.g. – this doesn’t make that much sense for those who
- Small RE investors who own multiple homes, second homes and vacation homes.
- Investors chasing yield if home prices start plateauing.
- Homeowners who bought a long time ago and are eyeing that equity they’d like to cash in
Of course this trend could slow or reverse but for now this is a very good sign. When we decided to wait to buy, this is one of the early indicators I was hoping to see.
Note this has not impacted prices at all yet, as they are still going up, but hopefully once inventory gets to 2019 levels, we’ll see some price correction or at least flattening.
Disclaimer: I’m an idiot first time home buyer. I’ve never taken an econ class in my life. I’m just sharing what I see and learn as it happens. I am 100% certain I will get things wrong, so don’t take any of this as the golden truth.