I’ve been thinking a lot about the speed of this correction. Is it going to be a slow 3 year long drawdown? Or are we looking at 20% or more within the year?
I’m starting to believe this correction could be faster than expected, perhaps 18 months to see 25% down in San Diego. That would put us at end of 2023.
I know, it sounds crazy and I warn you, that’s just my guess and not the result of any quantitative analysis. Just a qualitative look at everything’s that happening.
What I expected
When I first stopped searching in March, this was the timeline I was roughly expecting:
- By fall of 2022, the frenzy would die down due to rates and QT, and inventory would start building finally.
- Through the end of 2022, sellers would hold on to their desired prices but start to get antsy. Speculators would start to see the lack of appreciation and sell in favor of better investments.
- By early 2023, we would see price corrections, if at all they were to happen.
- If not, at least buying conditions will improve and make it safe to buy again.
What’s happened so far
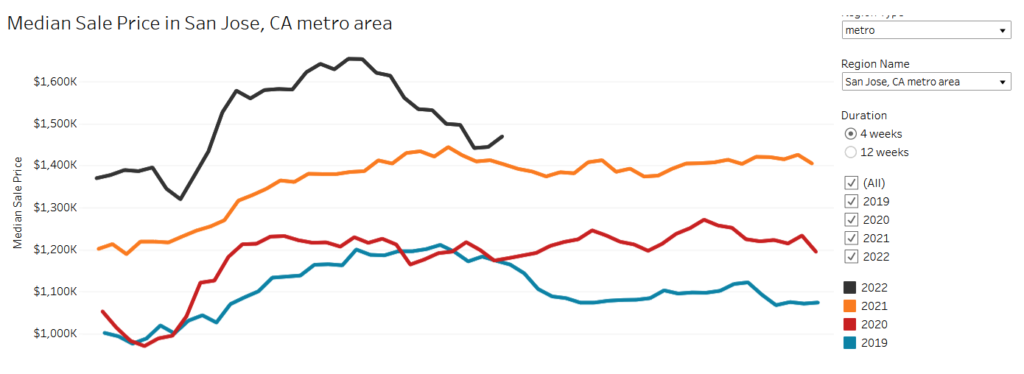
So here we are, in mid-July and already we’re seeing price declines. According to Redfin, as of July 17th, we have declines from the peak of 5% in San Diego, 14% in San Jose, 7.5% in San Francisco.
This is stunning to me. Why? Well if you look at Case-Shiller data for the 2008 crash, it took a few years for prices to start coming down. Here’s a Case-Shiller graph for San Diego, indexed to 2000.
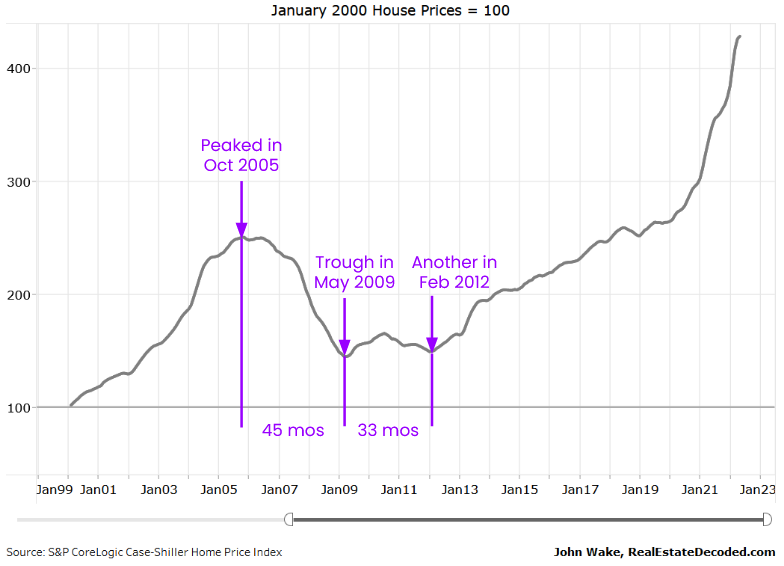
A couple of caveats – Case-Shiller is not the same as median price, as it uses a more sophisticated methodology to compare the same homes over time, and averages over 3 months. However, it’s also very lagging, so we’ll only be able to see the current housing prices reflected a few months from now.
Still, it’s one of the only free sources of regional home prices that shows data pre-2012. It was around 3.5 years from the peak to trough, and there was a second trough about 3 years later. That’s a long time.
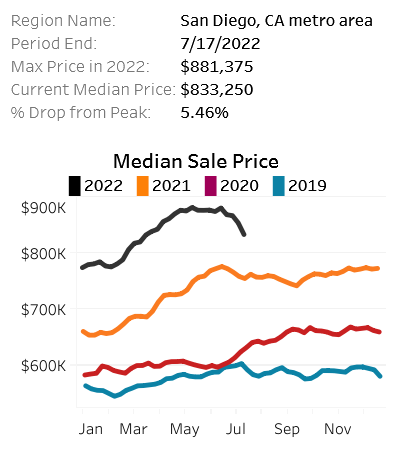
How about today? San Diego has dropped 5% from peak this year. You can see the peak was in May and we’re now in mid July, so it’s been… 2.5 months? We dropped from a high of $881k to $833k from May to July.
That’s a mind-boggling rate of change.
Remember it’s not apples to apples to apples, as this is not Case-Shiller, that data is not available yet. But still, it’s clearly moving a lot faster than it did back in 2006.
Why so fast this time?
So why are things moving this quickly?
1. Investors, investors, investors
One big reason is investors. I’ll explain what I mean.
In 2006, we had NINJA and subprime loans that went to regular people. Many people bought homes they couldn’t afford. But as prices started to fall, they couldn’t just walk away because they didn’t want to lose the home they lived in. If they were underwater, they needed to bring money to the table to sell. Even if they could sell, where would they go? Rents were high as well.
So most primary home owners aren’t that quick to react to falling prices. They want to make it work, they want to hold on to their home. So they held on as long as they could, until finally a job loss or a variable rate rise forced their hand. By this point, they couldn’t sell. So they started working with the banks to get loan modifications, and if unsuccessful, they foreclosed.
Instead of the tailwind a soaring stock market in 2006, today we have a headwind of a crashing tech and crypto market, wiping billions out of buyers’ hands.
This is a drawn out process. It can take anything from 5 months to 5 years for a foreclosure, depending on the state. On average it takes about 2 years. Which then totally makes sense that it took 2+ years for those waves of foreclosures to move through the system.
Today, we have a different situation. Yes, primary homeowners will not give up their home and low rate if they can help it, although some percentage will move due to jobs, death, divorce and the like.
But non-primary owners behave differently.
What’s different today is that a lot of homes were bought by non-primary buyers, or investors, of all flavors:
- Small landlords looking to rent out properties
- Homeowners who bought vacation and second homes to escape cities due to the pandemic
- Airbnb owners cashing in on the increased domestic travel and WFH
- Institutional investors buying to rent
- iBuyers and flippers intending to sell within the year
These owners can sell at their discretion, because they don’t live in these homes. And when the prices start falling (as they have already), these “discretionary sellers”, as Ivy Zelman calls them, are quick to head to the exits. They won’t be as sticky as primary homeowners. Already, this is visible in markets like Boise where the number of new listings (not overall inventory, just new listings) is currently 73% higher than last year.
“It’s the discretionary sellers that are going to be the primary drivers of this market.”
– Ivy Zelman
As to what percentage of the market these non-primary owners represent, it’s hard to tell. Estimates from Ivy Zelman, Redfin and JBREC range from 24% to 33%.
So, if you can imagine, when these investors start to sell, they set the comps and the price for the next sale. They don’t live in the house, and are speculating on appreciation. Once that flattens out or declines, they can get better yields elsewhere. Many small investors are so highly leveraged, they can only hold on if they can get rents to cover the mortgage. This house of cards is liable to fall fast if that changes.
Read more about how small investors are the new risky business.
2. Fed raising rates
In 2006, the Fed coasted by holding the Fed Funds rate at the same level, today the Fed is hitting the brakes by raising rates fast.
At the peak of the bubble in 2006, the Fed had rates at 5.25%. Yes, that’s higher than today but it’s important to look at the changes more than the level. After the peak, they never raised rates above 5.25% and to this day have not hit that level again (see green line below). They just held it steady and then dropped it in 2007. They did not tighten the screws further.
As a result, mortgage rates (which are not set by the fed but tend to correlate) hit 6.80% in July 2006 and never went higher either (see blue line below). At no point during the crisis (2006-2009) did the Fed raise rates or the 30yr fixed mortgage increase past its peak.
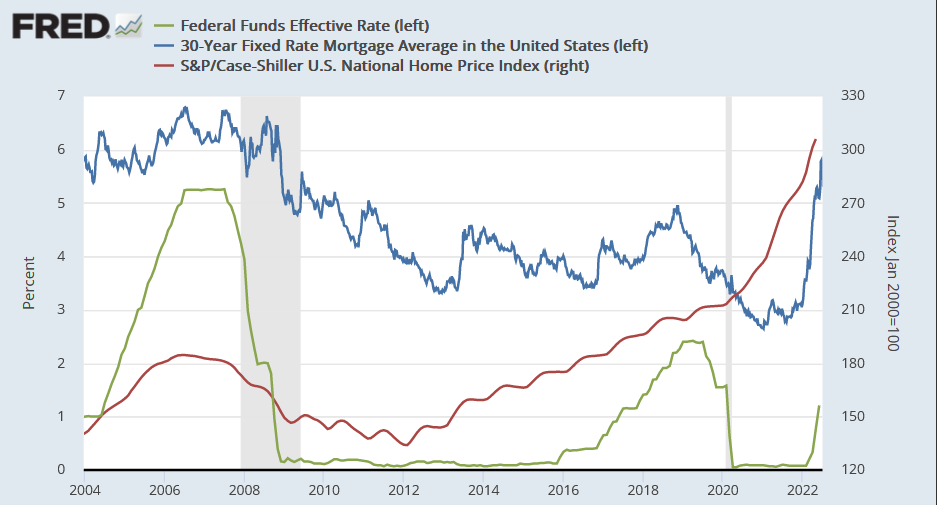
However, today we have a new problem – inflation is at a 40 year high of 9.1% year over year. And the Fed needs to get it under control. Which means they’re raising rates rapidly. So far they have raised rates a total of 2.25% and intend to continue.
Mr. Kashkari said in an interview. “The committee is united in our determination to get inflation back down to 2 percent, and I think we’re going to continue to do what we need to do until we are convinced that inflation is well on its way back down to 2 percent — and we are a long way away from that.”
– NYTimes
Why does this affect the housing market? With prices are at record highs, rising mortgage rates have already priced out all but the most determined buyers. Across the nation, demand has plummeted with pending home sales down 20% year over year nationally. In some markets (like San Diego), this figure is 40% down year over year.
In 2006, the Fed coasted by holding rates at the same level, today the Fed is hitting the brakes by raising rates.
On top of rates, the Fed has started QT, which should soak up liquidity from the economy. Again, this was not happening in 2006. In fact, it’s never really happened before so no one has a clear idea of how it will affect the market. At any rate, both these efforts tighten financial conditions into a possible recession. None of this was happening in 2006.
3. Everything everywhere crashing all at once
Which brings me to my next point. Back in 2006, when housing started to fall, it started to fall on its own – the stock market was climbing, unemployment was high, things were generally good. Even if only on the surface. Few seem to remember this, but the financial crisis happened after housing started to fall. It was a result of the housing decline.
Here’s housing prices vs the S&P 500.
- Home prices (black line) peaked in 2006 and plateaued for a while until it started falling in Mar 2007.
- Notice the S&P 500 (red line) kept climbing until Sep 2007.
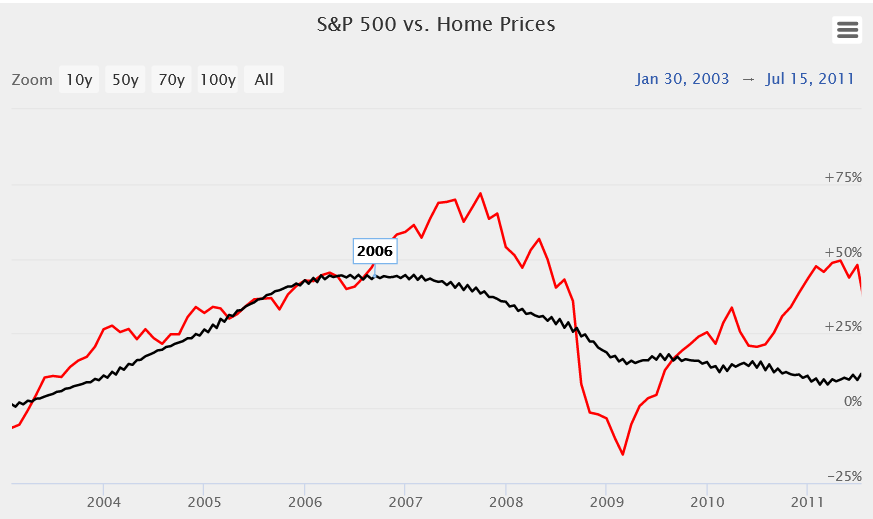
What does this mean? Well, housing started to decline first, on its own, while the stock market continued to grow. Eventually due to the subprime crisis, it leaked into global financial markets, causing the GFC (Global Financial Crisis).
Today, stock markets and crypto have been declining already since the beginning of the year (red line below). This has a dampening effect on housing because it affects buyers. Many that were relying on stock or crypto gains for their downpayment have now lost a chunk of that money. With the fed hiking, there’s likely to be a recession in the wings as well.
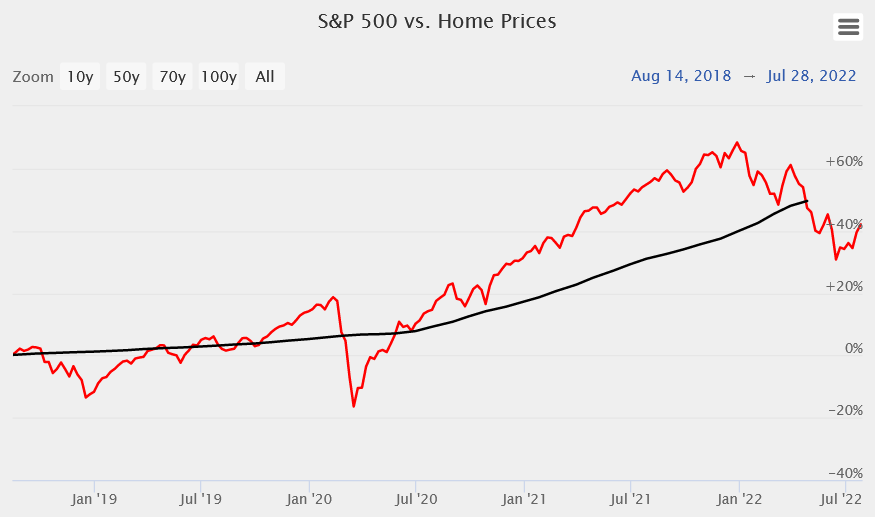
Instead of the tailwind from a soaring stock market in 2006, today we have a headwind from a crashing tech and crypto market, wiping billions out of buyers’ hands. Already, this has caused prices to drop in the most affected markets – San Francisco, Oakland, San Jose and Seattle. More will follow.
4. Zestimate factor
You know how everyone knows what their house is worth now? That’s because it’s so easy to check. It didn’t used to be that way. Zillow launched its Zestimate in 2006 but only launched its apps after 2009. So while people could check their Zestimate on their computers, they didn’t have it in their pockets at all times. They couldn’t get pinged every time a home sold in their neighborhood. Now all that is not only possible but common.
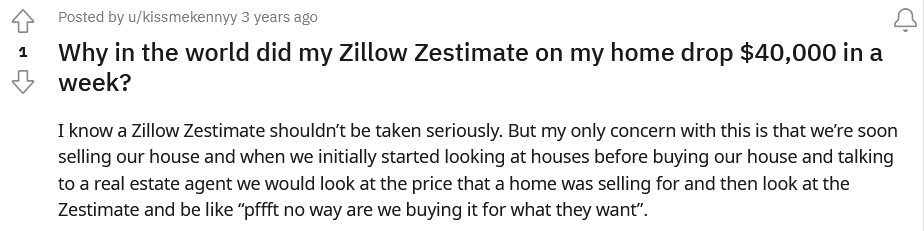
Everyone knows they shouldn’t “take their Zestimate seriously” but. they. can’t. help. it. It’s the biggest asset they own and if they vaguely intended to sell and downsize for e.g. and they start to see the price drop… it has an effect.

It isn’t just the zestimate – it’s the accessibility of data in general. Today I can head to the Redfin Data Center to quickly look at a dozen different stats across every metro and zip in the United States. If you’re watching a particular market, then you can see the stats before they even hit the news.
Today this headline hit the news, revealing that San Jose had dropped 3.2% in June.
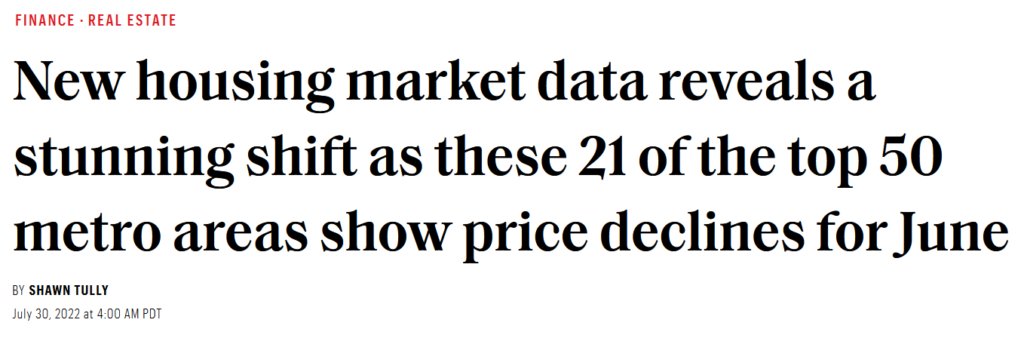
However, I can pop into Redfin, and see that as of July 24th, San Jose median price is down 11%. Back in 2008, this sort of data simply wasn’t accessible to the average user.
This has caused many aspects of the RE cycle to speed up. In the last year, days on market dropped to 7 days in some markets because buyers can react immediately to a listing. So the data will affect behavior in ways that didn’t exist in 2006. While I believe prices are stickier on the way down, I don’t believe they’ll be as slow to move as in the past.
5. It happened before
In 2005, Ben Bernanke said it was a pretty unlikely possibility that prices would come down, and today we all scoff at him for it.
Interviewer: What is the worst case scenario, if in fact we were to see prices come down substantially across the country?
Ben Bernanke: Well, I guess I don’t buy your premise. It’s a pretty unlikely possibility. We’ve never had a decline in house prices on a nationwide basis. So what I think is more likely is that house prices will slow, maybe stabilize: might slow consumption spending a bit.
– Ben Bernanke on CNBC
But, at least he was right on one point, we had never had a decline in house prices on a nationwide basis at that point. People simply didn’t believe it could happen. Builders kept building, investors kept investing, there was incredible denial. Ivy Zelman famously asked the Toll Brothers CEO on the Q4 2006 conference call “Which Kool-Aid Are You Drinking?”
A 20% drop in prices of new homes shows that the builders were quicker to put down the Kool-Aid this time.
Today – at least some people remember that it did. Case-Shiller graphs exist for anyone who wants to look up how much their market declined the last time. They might even notice that some markets didn’t recover for a decade. Which means some might be quicker to drop prices and head to the exits earlier rather than later.
Look at the average price of new homes as of today. It’s dropped 20%.
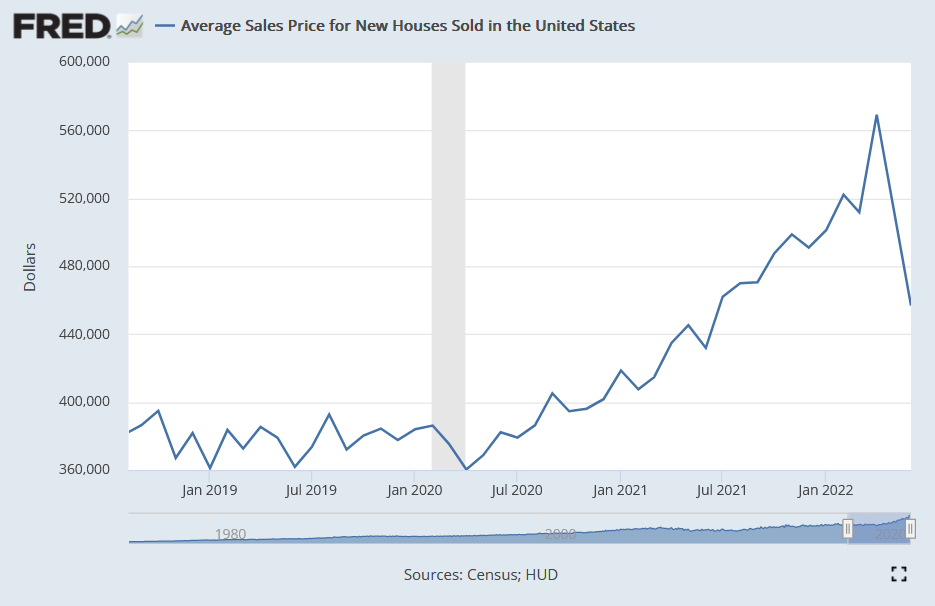
What does this mean? It’s just new homes, so this price is set by builders. A 20% drop in prices of new homes shows that the builders were quicker to put down the Kool-Aid this time. And while this price drop is not reflected in existing homes yet, in many markets those existing homes are now competing with a 20% drop in comparable new homes.
So this time around, builders, investors and sellers will all have the niggling worry that massive price declines nationwide are indeed possible and have happened in the not so distant past. It may make them more reactive than they ever were in 2006.
How fast will it correct?
I’ll be honest, I have no idea. I believe all of the above means that it could correct faster than last time. I know that many believe there’s no chance of it correcting anywhere like it did last time.
In 2006, the forced selling of the foreclosures set the speed and the magnitude of the decline. There was a cascading effect where the first set of foreclosures set prices that pushed more homes underwater. And that led to further foreclosures at even lower prices. That isn’t likely to happen this time.
However, these other forces – discretionary sellers, the Fed, the financial market correction and the accessibility of data – can build downward momentum as well. If you look at the yoy rise, it has been stunning. The median annual appreciation topped out at 21%, a full 40% higher than in 2006. Prior to 2020, I’m sure no one could have foreseen annual appreciation at 20%+, since that had never happened before either.
So for the reasons above, I think we could be in for a rollercoaster. For funsies, my guess is 18 months to see 25% down in San Diego.
Disclaimer: I’m an idiot first time home buyer. I’ve never taken an econ class in my life. I’m just sharing what I see and learn as it happens. I am 100% certain I will get things wrong, so don’t take any of this as the golden truth.
The widespread use of social media and the internet as compare to 2006 is another factor that may accelerate a decline in prices. Just as social media and the internet discussions affected (manipulated) the stock market in the past few years.