I’ve noticed that a lot of people only look at the data that shows up in the news and don’t know how to look up the most recent data for themselves, on their own market.
Buyers – look up the data yourself so you can make an educated decision on how to maneuver in this market. Don’t count on your realtor to tell you the absolute truth, their incentives are different from yours, and you’re the only one that has to live with your decision. Don’t count on the media either, for reasons I’ll explain as well.
I’ll share instructions on how to get access to real data in upcoming posts and link them here.
Why is this important?
Most of the data you’ll see in the news is shared by people who depend on the RE industry, and naturally, are promoting their industry.
Here’s an example – say you look up “san diego price drops housing” to see if any price drops are happening. Here’s what I get on google…
- From noradarealestate.com, “The company now predicts home prices will go up 14.9% between March 2022 and March 2023.”
- From luxurysocalrealty.com, “It’s unlikely San Diego housing prices will drop next year in 2022 and highly likely prices will have increased over 10% from 2021.”
- From sandiegorealestatehunter.com, “San Diego Housing Bubble? 5 Reasons It Won’t Crash 2022″
- From nbcsandiego.com, “How Long Can the San Diego Housing Market Stay This Hot?”
- From sandiegouniontribute.com, “San Diego home prices accelerating at a pace not seen”
You get the picture. There clearly hasn’t been a single price drop in San Diego.
To the data
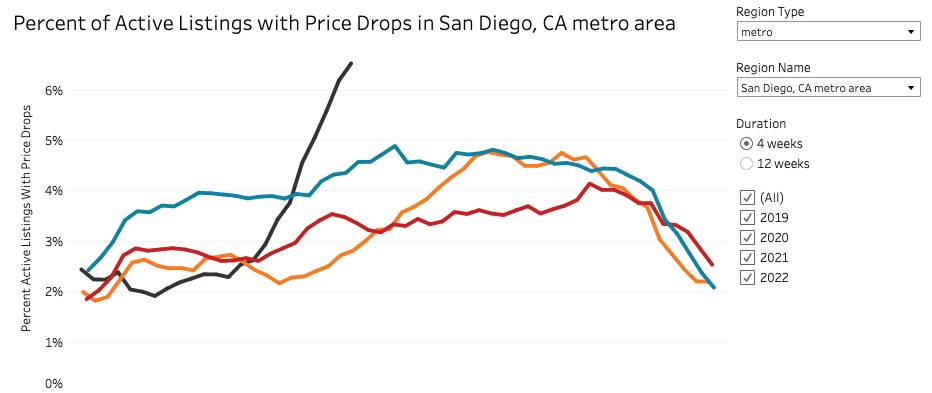
On the other hand, here’s the graph of price drops in San Diego, from Redfin. Black line is 2022, other lines are previous years. This shows the 4 week moving average but is updated weekly.
Look at that! It’s flying off the damn chart.
Here’s another, from Altos Research. This is updated weekly and shows the weekly data (the dashed line), which is awesome. Also the markers showing the levels in previous years are pretty handy – makes it easy to eyeball that weekly price drops are greater than 2021 and 2020 but not 2019.
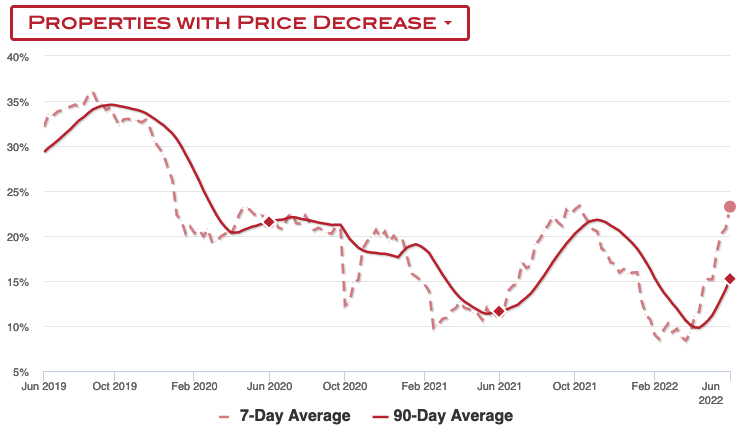
If you’re concerned this data doesn’t match the previous, don’t be. Each company has different ways to gather and aggregate the data, they’re going to be different. But the trend should be the same. And as long as they don’t change methodology, you can just compare against their own historical data.
Note that price drops are not the same as a decline in median price. It means that people are dropping prices on listing prices, but until those houses sell, it will not show up as a decline in home prices. However, it is a leading indicator as when those houses do eventually sell, it’s likely that it will affect median home prices.
Why search didn’t work
So why didn’t searching for this data help?
SEO
It’s simple, this isn’t news that the real estate industry is likely to promote. So, if there’s a positive and negative piece of news for RE, you’ll get 100 articles about the former, and one about the latter. And the 100 articles will be SEO’d to the max to show up at the top of your search, and maybe even promoted with some ad money.
The one article that’s negative, it will end up buried in search. And it won’t be about your market, but maybe about national data.
Here’s one from Redfin, it isn’t about San Diego, and didn’t show up in the first page:
Nearly one in five (19.1%) home sellers dropped their price during the four week period ending May 22—the highest level since October 2019.
– Housing Market Update: Nearly 1 in 5 Sellers is Dropping Their Price, Redfin
Narrative
Another reason is that there’s a narrative that the RE industry is going to want to sell. This is one interpretation of the data and the one that you’ll see most repeated. Price drops don’t fit the narrative that housing is going to continue to appreciate this year.
Buyers – look up the data yourself so you can make an educated decision on how to maneuver in this market.
As mentioned before, most articles will have sources that work within the industry. Even when they mention “economists”, you read the article to realize they mean “the chief economist at Redfin” or “Lawrence Yun, chief economist at NAR”. Some are literal cheerleaders for the industry. At the very least, they might downplay certain items and sensationalize others.
Last bubble, there was literally a site, called LawrenceYunWatch, just to watch the terribly wrong predictions of Lawrence Yun, at NAR. If you want to laugh, here’s a graph of all the predictions he made back then. After you’re done laughing, you’ll be left wondering how he kept his job.
Lagging
Another reason it’s hard to keep your finger on the pulse, is that the articles tend to get written one month later. So typically in June, you’ll see articles about May data. And again, it may not be about your market.
So it’s better to watch data that’s localized, and updated weekly, for e.g.
- Altos graph was updated June 3rd.
- Redfin’s graph was updated June 5th.
Both were update last week basically. And that my friend, is why you need to go to the data yourself, so I’ll share some good sources that are leading, early data, in upcoming posts.
Data Sources
Disclaimer: I’m an idiot first time home buyer. I’ve never taken an econ class in my life. I’m just sharing what I see and learn as it happens. I am 100% certain I will get things wrong, so don’t take any of this as the golden truth.