Since I live in San Diego, I try to watch the San Diego market. Real estate is very localized and it’s entirely possible to have too much housing in one place and not enough housing in another.
Anecdotally, I’m not seeing a lot of change in San Diego, not a lot of houses appearing in inventory or sitting. Rental vacancy continues to be tight and rents keep going up.
But there’s one glimmer of hope in the data if you dig it up. So I figured I’d collect some charts here to get a snapshot of how San Diego feels today in late April, 2022.
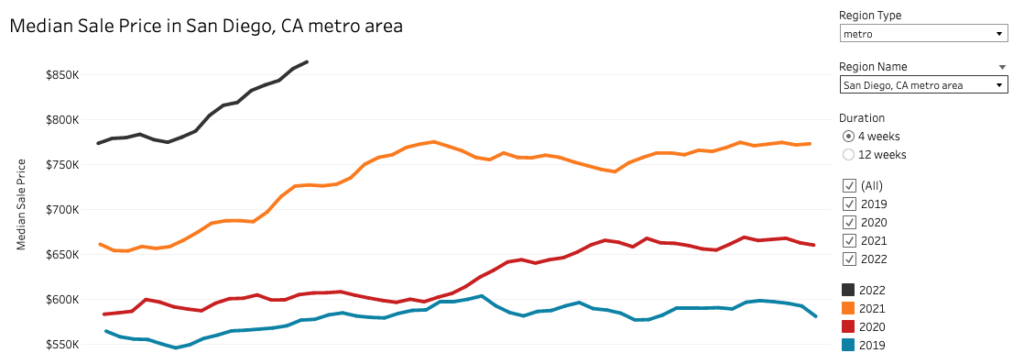
Housing Cost
Median sale price has been going up rather rapidly with no change in sight. The slope seems to be similar to 2021, and both are much higher than the previous 2 years.
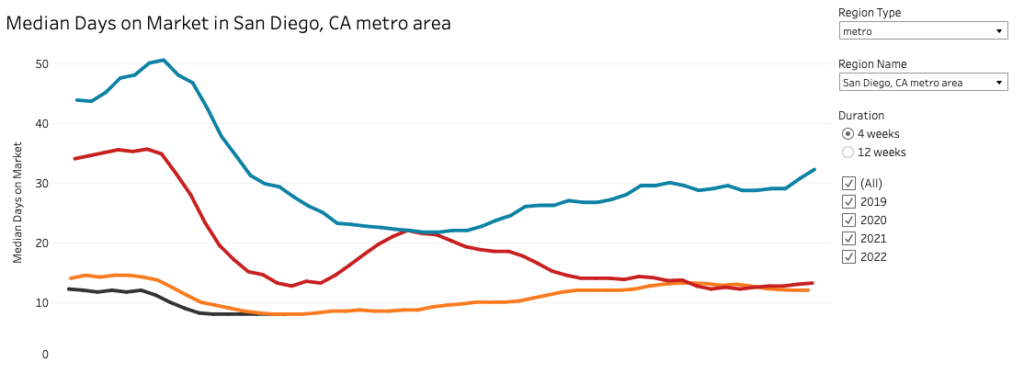
Median Days on Market
Median days of market are low, low, low. Like dirt low. Can it even go lower?
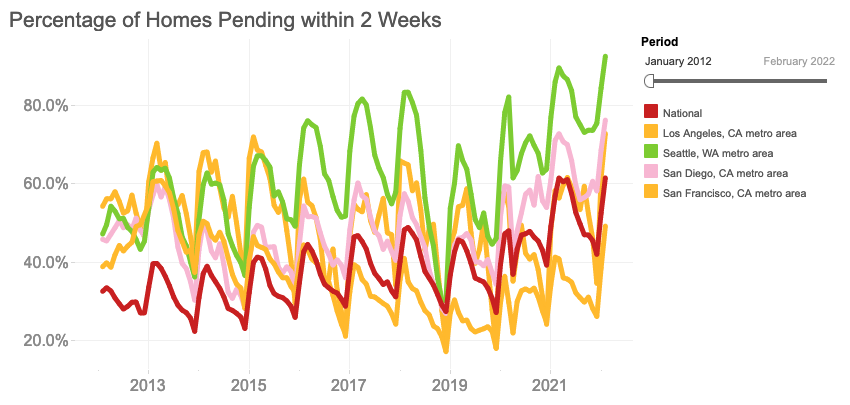
Percentage Pending within 2 Weeks
This is another view on the previous measure, but it’s a good comparison to other west coast metros. As you can see Seattle is moving faster than San Diego but San Diego is well ahead of the pack, moving even faster than San Francisco. This means we are a lot further off from a correction, than many other cities.
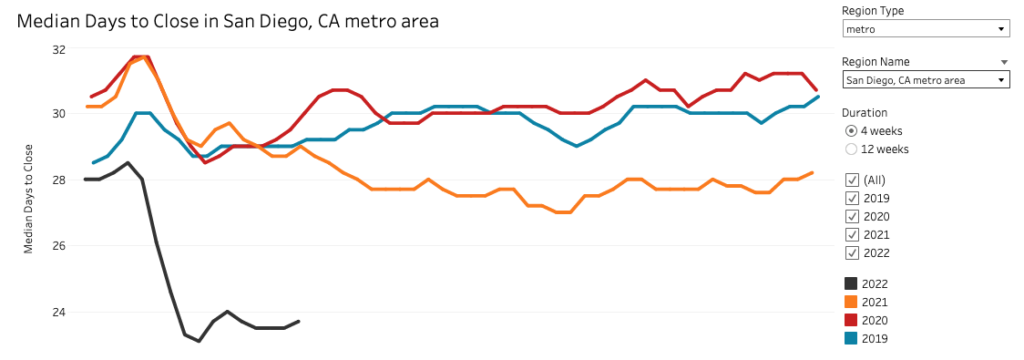
Median Days to Close
Note the scale here, it’s quite narrow but about 20% down – apparently we’ve gotten super efficient at closing. This says to me that a lot of inspections are still being waived, and maybe people are trying to close as fast as possible to get lower rates.
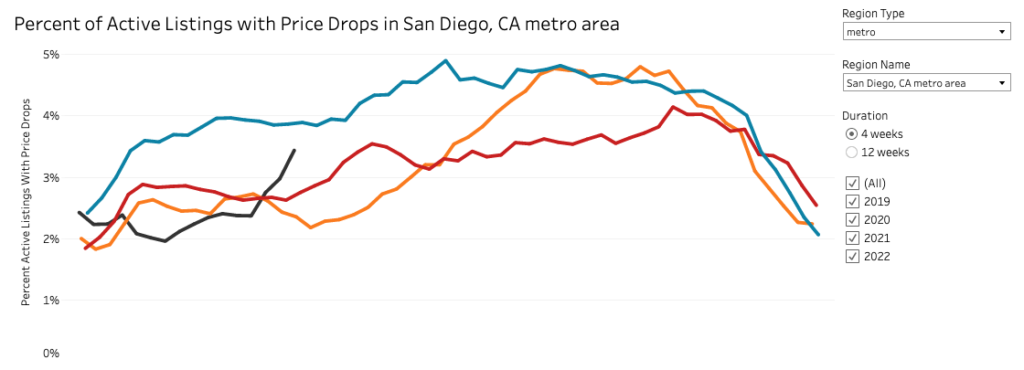
Percent of Active Listings with Price Drops
Finally, a glimmer of home in the price drop data. More active listings have price drops than last year. But more interesting is the slope, the increase in price drops is growing faster that in has in any of the past three years. Is this a sign of change? Or a new realtor strategy to “bump” listings back into app feeds? Given that homes aren’t really sitting longer on the market, I see no reason for there to be more “bumping” than in previous years.
Inventory
Redfin does not provide weekly data for inventory (surprising since this is the most often used stat to induce FOMO) but I put together this chart of YOY changes from Realtor.com data. What this shows is that although San Diego has had much lower inventory from last year, -15% in mid April compared to the same week last year – this has been steadily improving each month this year.
In Jan, active listings were 50% less than a year go. And today they are only 15% less than a year ago. That definitely seems like good news although we have a bit more to go to get positive so we need to see this trend continue.
Active Listing Count Change YOY
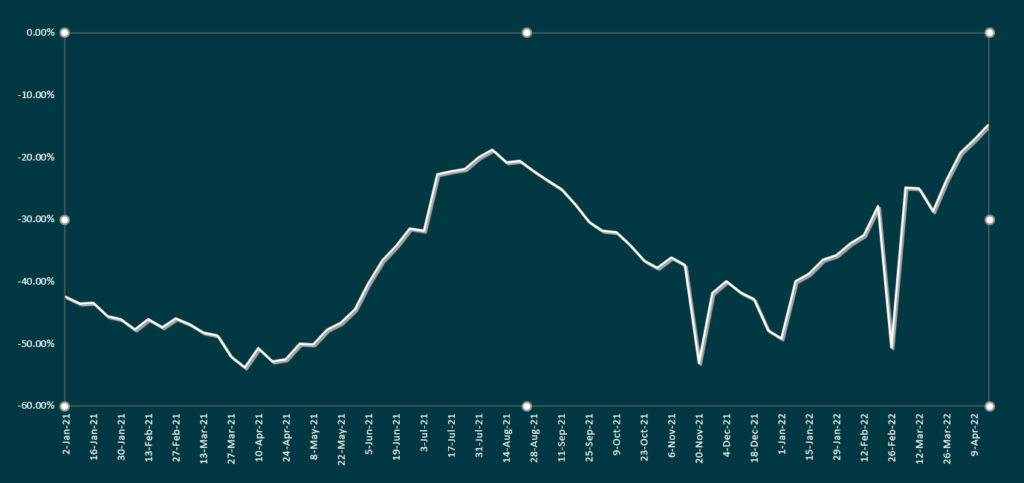
This reflects something I saw on twitter today from Mike Simonsen of Altos Research.
For the first time in years, California inventory shows a slight uptick from the same time last year, vs. a large drop. We aren’t there yet in San Diego, but it goes to show this is an overall market trend.
On that slightly positive note, I’ll end this post. The San Diego market feels as hot as ever with only the slightest signs of change. Personally, I think it’s because the rental market is stronger than ever what with Airbnb and UCSD student renters increasing due to Covid. But later this year, both those things look poised to change, so we’ll see what effect that has.
Disclaimer: I’m an idiot first time home buyer. I’ve never taken an econ class in my life. I’m just sharing what I see and learn as it happens. I am 100% certain I will get things wrong, so don’t take any of this as the golden truth.