Recently, Rick Palacios Jr. from John Burns Real Estate Consulting posted a very interesting statistic related to DTI. I’ve written before on how it seems like many people are getting loans at shockingly high DTIs, but of course, all I’ve had is anecdotes. Rick’s got the data.
The image is a little hard to read so I’ll break down my interpretation.
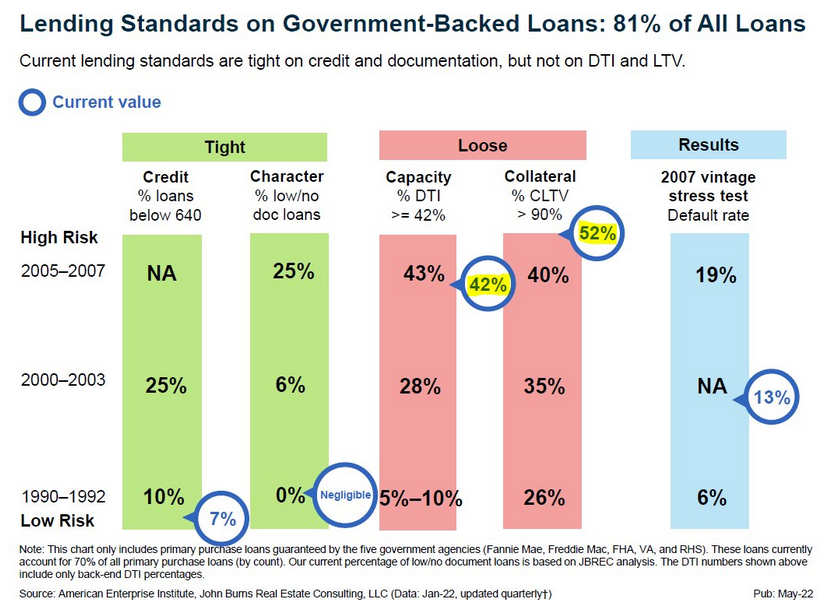
FICO and docs look good
Basically this is saying that if you look at credit score and documentation, lenders have tightened up since the last crisis. Today the number of low documentation or no documentation loans is negligible. Whereas in 2005-2007, that was 25% of loans.
Similarly, only 7% of buyers today have a FICO score below 640. So, on these two fronts, government-backed lenders like Fannie and Freddie have tightened requirements.
DTI not so good
But then we look at the next two. 42% of borrowers have a DTI greater than 42% compared to 43% prior to the GFC (Great Financial Crisis). That’s not… very different. A high DTI puts people one job loss or emergency away from defaulting. With a recession looming this is a very scary statistic to see. And yet no one is talking about it.
As I described before, no one that buyers interact with during the buying process really explains DTI to them. Which is sad because this is how people get into trouble.
LTV even worse
CLTV is Combined Loan To Value which means the combined loans on a property to the value of the property. 52% of homeowners have a CLTV greater than 90%, compared to 40% prior to the GFC. This is much worse than it was back then.
Again, a surprising statistic no one is talking about. Especially since studies have shown that LTV matters as much, if not more, than credit scores when predicting if someone will walk away from their loan.
But but FICO!
But the credit scores are great, you say? Which means we don’t have a subprime issue like last time! Well, a detailed study of the mortgage crisis by NBER (National Bureau of Economic Research) found that “The U.S. Foreclosure Crisis Was Not Just a Subprime Event”.
The researchers find that the crisis was not solely, or even primarily, a subprime sector event. It began that way, but quickly expanded into a much broader phenomenon dominated by prime borrowers’ loss of homes.
– NBER
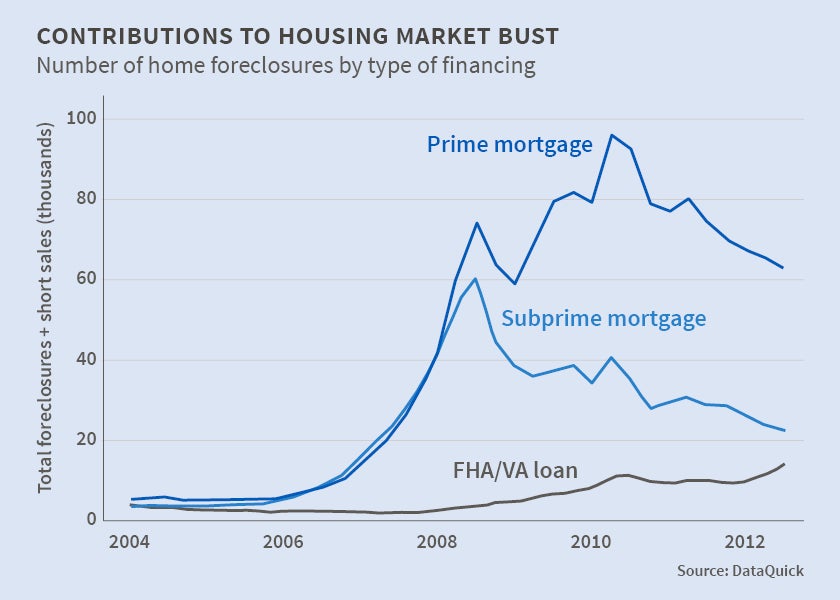
Subprime and Prime are categories of buyers mostly dependent on credit scores. Instead, the researchers found that negative equity was the huge driver of foreclosures. And as you can probably guess, the higher the LTV, the more easily the borrower falls into negative equity.
Current LTV is a powerful predictor of home loss, regardless of borrower type. This is consistent with the implications of a traditional home mortgage default literature which shows that negative equity changes an owner’s incentive to keep current on one’s loan.
– A new look at the foreclosure crisis, NBER
In fact, the same paper points out that another trigger for the decision to default, and that is illiquidity (lack of reserves) arising from negative income shocks (a job loss). And who finds themselves illiquid after a job loss? Housepoor buyers who stretched on both the cost of the house, and their DTI.
The traditional mortgage default literature also posits a potentially important role for borrower illiquidity (typically thought of as arising from negative income shocks) in the decision to default, which is a precursor to losing one’s home.
– A new look at the foreclosure crisis, NBER
Double Trigger Hypothesis
In fact, this isn’t the first paper to point this out. There’s a name for this phenomenon and it’s called the double trigger hypothesis.
The double-trigger hypothesis posited that it is an unanticipated negative change (henceforth, shock) to an individual borrower’s ability to repay their mortgage that leads to missed payments, and the combination with negative equity that leads to foreclosures.
– Reserve Bank of Australia
Basically, there is a ton of literature pointing to these 2 conditions triggering foreclosures.
Negative Equity + Lack of liquidity = Foreclosure
How do we get negative equity? High LTV purchases followed by a drop in prices. The data shows we have many more high LTV purchases than we did pre-GFC.
How do we get lack of liquidity? Multiple ways.
- Buyers stretching to buy homes at the edge of affordability makes they house poor. As home affordability is nearly the worst on record, it’s unsurprising that many buyers are doing just that. Basically the only time it’s been worse, was back in July 2006. So it’s no surprise the data shows DTI matching that of the pre-GFC runup.
- Buyers using remaining funds to cover appraisal gaps and complete inspection repairs to homes that would normally be negotiated at the time of purchase.
- Reserves being wiped out by other economic forces. Tech and crypto have had a bloodbath in the last few months. If buyers had reserves invested in either of those, their reserves are now a fraction of what they thought they had.
Here we go again
So precursors to these two conditions, illiquidity and negative equity, are shockingly high today. Even worse than what they were pre-GFC. And these two conditions are the biggest driver of foreclosures.
I’ve seen the anecdotes about high DTI and LTV but this data shows it’s more than anecdotal. If that doesn’t make your heart drop into your stomach, I don’t know what will. The fact that we are back here in this situation, such a short time after the previous crisis is appalling, especially if many people lose their homes, as they did the last time.
Disclaimer: I’m an idiot first time home buyer. I’ve never taken an econ class in my life. I’m just sharing what I see and learn as it happens. I am 100% certain I will get things wrong, so don’t take any of this as the golden truth.