San Diego inventory hit an important milestone this week, which is that it finally recovered to 2021 levels. A few months ago, inventory was down 50% seasonally, and as of this last week, it is now the same as it was this time last year.
Seasonal Inventory
Inventory has been building all year – however this is perfectly normal for this time of year. This is just a seasonal pattern for real estate. It builds in spring and subsides in the fall. You can see it in graphs of inventory – with the summers showing up as bumps in the graph.
And you can see it in the data for this year as well. Which is a normal pattern and doesn’t tell us if there has been any real easing of the housing market.
What’s more notable is whether the inventory is recovering more than the seasonal pattern. To do this, we look at the year over year change in inventory.
The weekly inventory of homes in San Diego today is the same as it was one year ago. This is the first time it has done that since July 2019
Realtor.com reports this weekly inventory change yoy and below is the graph of that data for San Diego. As you can see, in Jan the inventory was -50% of the previous years inventory at that time. That is really really bad. (Ignore the dips in Nov and Feb, those are likely due to thanksgiving and the Russian invasion of Ukraine.)
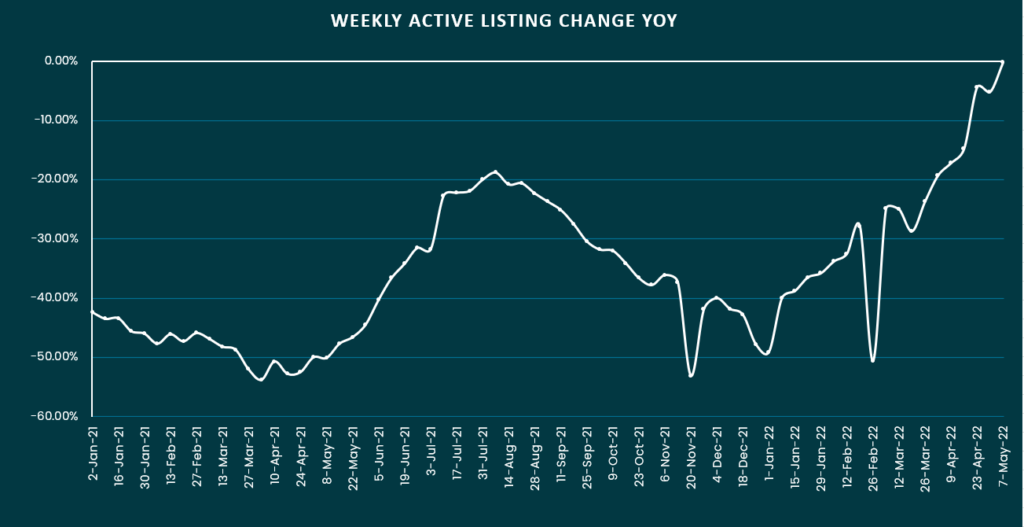
But there’s good news! As of this past week, the yoy change in inventory touched 0% – well to be precise -0.2%. This means that the weekly inventory of homes in San Diego today is the same as it was one year ago. In fact, inventory has built back all the way from -50% to 0% over the first part of 2022. This is the first time it has done that since July 2019 when it first started to fall yoy.
At the same time, it’s important to remember that inventory is still very very low historically. So this news by no means implies that prices will fall today. For that we need the inventory numbers to reach a couple of months of supply.
There are a series of milestones to watch out for, which I saw at CalculatedRisk, who shares this data nationally. As of this week, we’ve hit 2 of those milestones.
Housing Inventory Milestones to Watch (from CalculatedRisk)
- The seasonal bottom. ✅
- Inventory up year-over-year✅
- Inventory up compared to two years ago
- Inventory back to median for last decade
We have two more milestones to track.
When to buy
The reason I like these milestones is because this is roughly how I’m waiting to find the right time to step back into the market. People keep asking – how low will the price go? How big will the correction be?
But it’s impossible to tell. And I just want a fair price and a balanced or buyer’s market. So all I’m looking for is 2-3 months of supply or 4000 homes in inventory.
I also don’t want to buy when things are falling so rapidly that on closing, I’ll be underwater, so I’ll be watching for some price stability as well.
If it feels like a long time to wait, it is. But it’s easier to be patient on the way down. I’m cautiously optimistic because of course this trend could reverse. However, the bloodbath in tech and crypto is wiping out billions from the economy – 200 billion was wiped out in a single day yesterday – and housing has never been less affordable since 2008, so I don’t see yet why this trend might reverse barring a pivot from the Fed.
Disclaimer: I’m an idiot first time home buyer. I’ve never taken an econ class in my life. I’m just sharing what I see and learn as it happens. I am 100% certain I will get things wrong, so don’t take any of this as the golden truth.